Potential biological effects are described by CCOHS for higher exposures; they are not specific symptom thresholds for the selected ppm. Concentration, duration and individual circumstances influence responses.
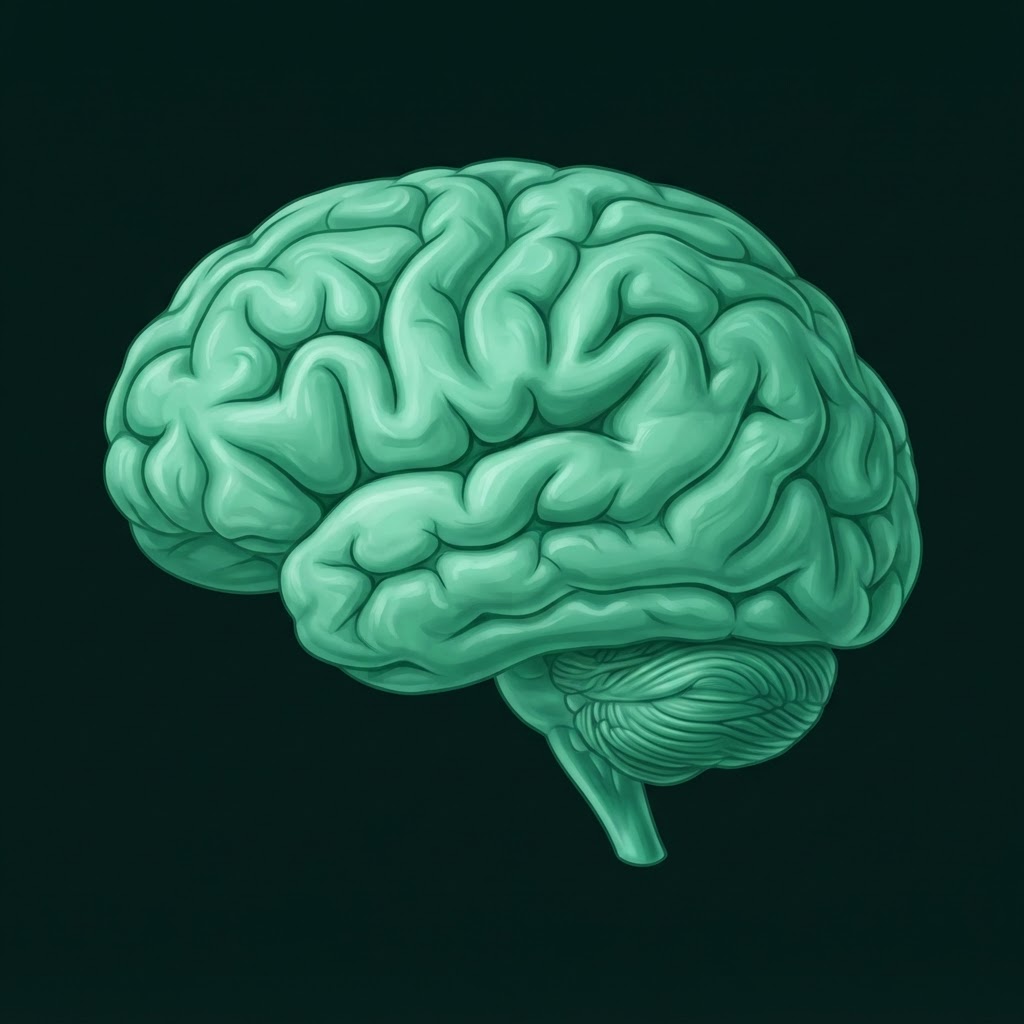
Allen et al. · Controlled exposure study of cognitive function reports lower cognitive function scores with increased CO₂. Findings vary across studies and tasks; the graphic's linear colour fade is illustrative, not a research-derived percentage loss.
The graphic uses an AI-generated anatomical illustration and illustrative response indexes, not measured cognitive capacity, metabolism or recovery. Modelled air oxygen is not blood oxygen saturation. CO₂ alone cannot establish a recovery percentage or a personal breathing rate.
NIOSH lists a 5,000 ppm time-weighted occupational limit, a 30,000 ppm short-term limit and 40,000 ppm as immediately dangerous to life or health. Occupational limits are not classroom targets or infant safety thresholds. 10,000 ppm is a demonstration endpoint, not an industrial exposure limit.
Cedeño Laurent et al. (2021) · Global CogFx, Environ. Res. Lett. followed 302 office workers in six countries: each 10 µg/m³ PM2.5 increase was associated with 0.8–0.9% slower response times, and each 500 ppm CO₂ increase with 1.4–1.8% slower responses; no lower threshold was observed. Tang et al. (2024) · Mendelian randomization, AAQR reports a causal association between NOx and reduced cognitive function (not for PM2.5 or NO₂ in that design); cohort studies link long-term NO₂ to cognitive decline. Evidence strength differs by pollutant and exposure duration.
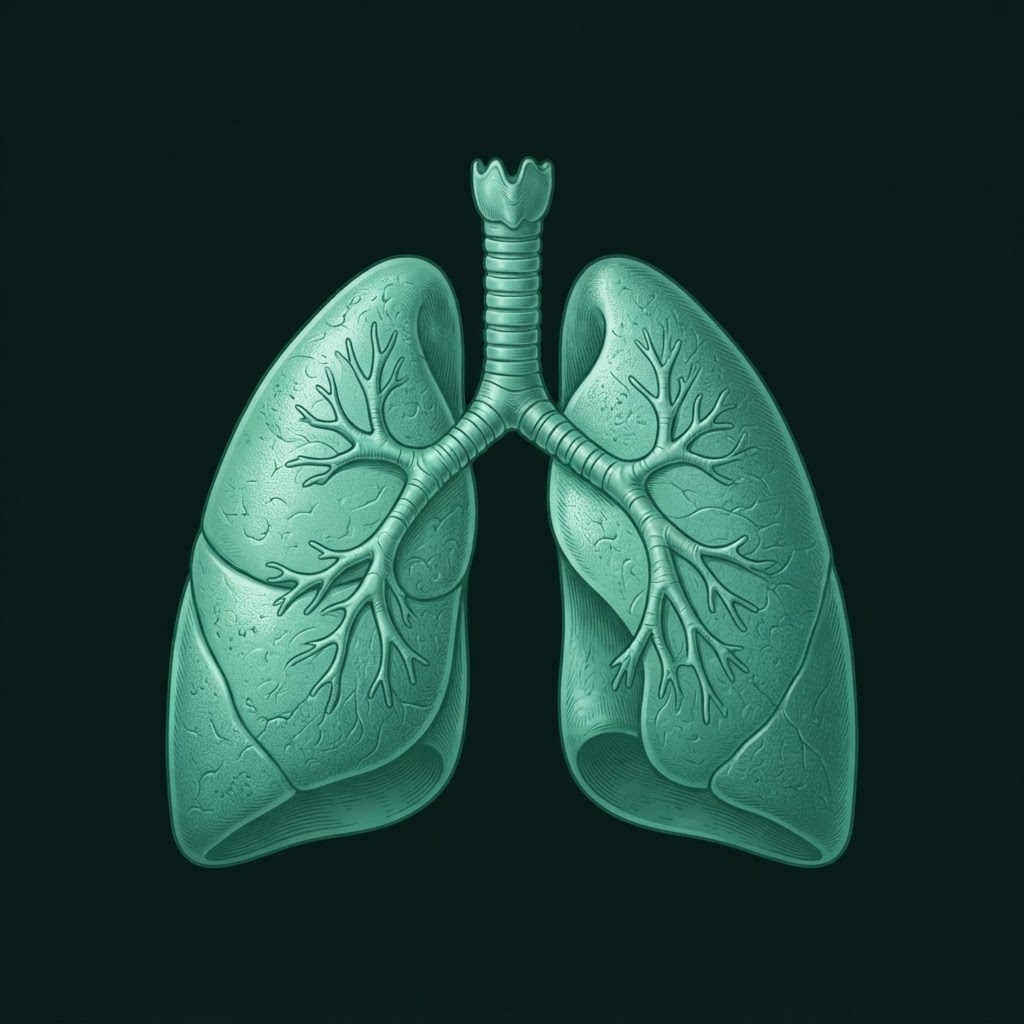
Lung colour shift uses PM2.5 0.65 / NOx 0.35 (design-only). WHO, EPA and HEI link PM2.5 and NO₂ to reduced lung function, airway inflammation and aggravated asthma. The hue is an illustrative exposure index, not lung function or disease probability.
Model v3 uses normalized inputs with design-only weights: cognitive graphic CO₂ 0.5 / TVOC 0.2 / PM2.5 0.2 / NOx 0.1; breathing 0.3 / 0.3 / 0.4; metabolism and recovery 0.34 / 0.33 / 0.33. Breathing spans 12–34 bpm, metabolism 100–85%, recovery 100–65%, and green tint 100–0%. These are arbitrary visual endpoints, not research-fitted physiological predictions. Fully gray does not mean zero brain function. Oxygen dilution remains CO₂-only; particles and trace VOCs are not treated as oxygen displacement.
EPA · VOC health effects describes nervous-system effects of some VOCs, not a general TVOC cognitive decline curve. TVOC is a mixture-dependent, sensor-equivalent reading here; chemical identity and calibration are unspecified. Independent pollutant inputs improve exposure exploration, not validated disease-prediction accuracy.
Sources consulted 14 September 2026. Educational use only; seek qualified health and ventilation advice for real exposures.
WHO reference overlay · verified 15 September 2026. PM2.5 guideline: 15 µg/m³ (24-hour mean, 99th percentile of daily means) and 5 µg/m³ (annual mean). The 24-hour interim targets are 25, 37.5, 50 and 75 µg/m³ (IT4 to IT1). Slider band boundaries use these values on the existing linear 0–500 scale; colours are app-defined. Interim targets are progressive reduction goals, not disease categories or safe exposure limits. The annual value is not used to colour a 24-hour comparison. WHO guideline executive summary · Table 1
CO₂ and total TVOC have no equivalent guideline values in the cited WHO guidance, so their tracks are neutral. WHO guidelines address individual pollutants, not the combined illness indices used here; this reference overlay does not validate or change the simulation.
05 / Kidney & bone · Evidence
EPA identifies kidney effects from some VOCs, not a universal TVOC dose–response. Duarte et al. is a hypothesis review, not proof of kidney calcification or bone disease at indoor CO₂ levels. The mixed bar is an exposure illustration only; PM2.5 is not assigned a weight here because the cited sources do not establish this relationship.
Visual weights: CO₂ 0.4, TVOC 0.6, PM2.5 0, NOx 0. Visual weights are design assumptions, not evidence-derived effect sizes; zero means excluded from this illustration, not proven harmless.
06 / Cardiovascular · Evidence
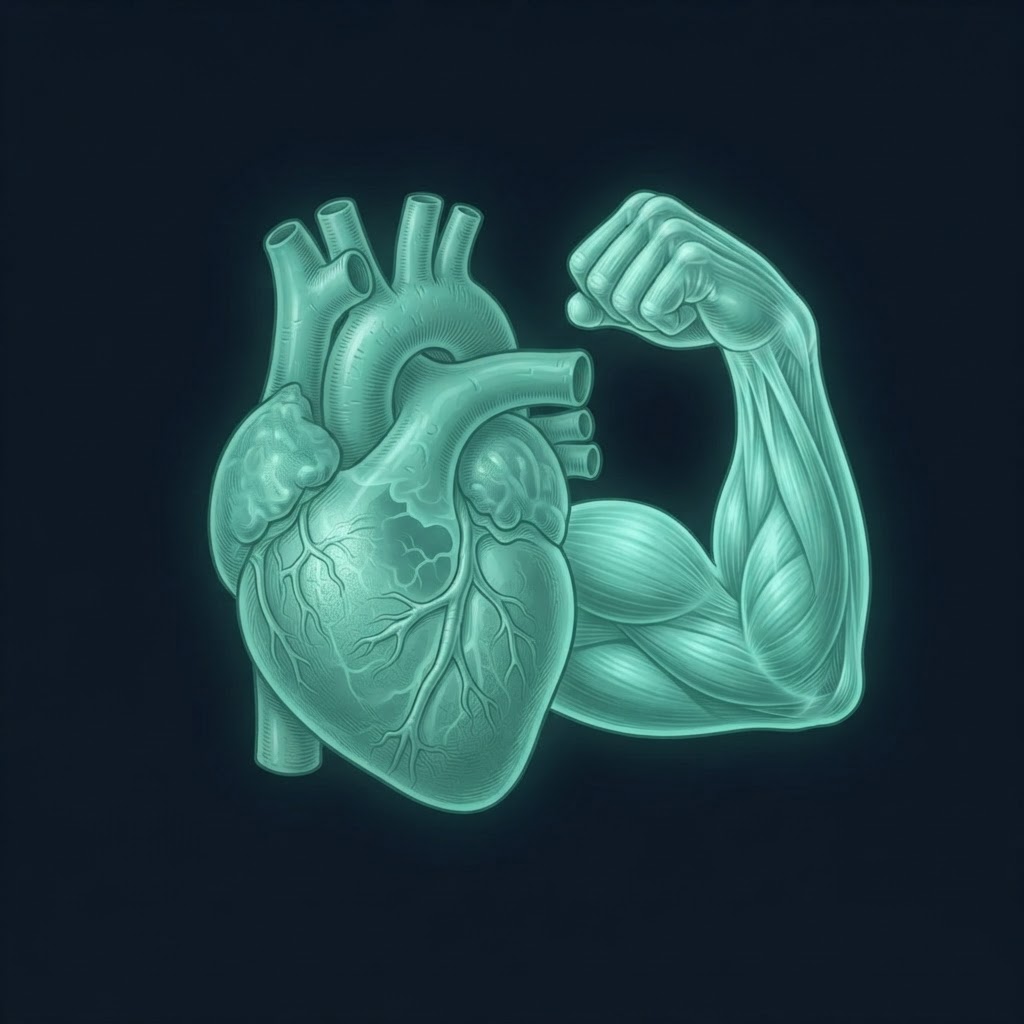
WHO links fine-particle exposure to cardiovascular disease; EPA lists heart attacks and irregular heartbeat. Duration, susceptibility and particle composition matter. CO₂ and aggregate TVOC are intentionally excluded: these inputs do not support a validated cardiovascular disease calculation.
Visual weights: CO₂ 0, TVOC 0, PM2.5 1, NOx 0. Visual weights are design assumptions, not evidence-derived effect sizes; zero means excluded from this illustration, not proven harmless.
07 / Respiratory · Evidence
CCOHS describes respiratory effects at high CO₂ exposure. EPA describes airway effects of particle pollution, some VOCs and NO₂ (airway inflammation, aggravated asthma). The combined visual weighting is a design choice: these sources do not validate additive effects, interactions or a breathing-rate equation.
Visual weights: CO₂ 0.25, TVOC 0.25, PM2.5 0.3, NOx 0.2. Visual weights are design assumptions, not evidence-derived effect sizes; zero means excluded from this illustration, not proven harmless.
08 / Lung cancer & air pollution · Evidence
IARC Group 1 denotes sufficient evidence of carcinogenicity, not equal risk across exposures. Long-term exposure matters; an instantaneous concentration does not predict cancer. Some specific VOCs are carcinogenic, but total TVOC cannot identify them, so TVOC and CO₂ have zero visual weight here. This is not a zero-risk claim.
Visual weights: CO₂ 0, TVOC 0, PM2.5 1, NOx 0. Visual weights are design assumptions, not evidence-derived effect sizes; zero means excluded from this illustration, not proven harmless.
09 / Asthma aggravation · Evidence
EPA explicitly links particulate pollution to aggravated asthma, airway symptoms and reduced lung function. Individual triggers vary. This PM2.5-only illustration does not model asthma onset, attacks or individual VOC triggers; total TVOC does not specify the chemicals present.
Visual weights: CO₂ 0, TVOC 0, PM2.5 1, NOx 0. Visual weights are design assumptions, not evidence-derived effect sizes; zero means excluded from this illustration, not proven harmless.
10 / Irritation & discomfort · Evidence
EPA lists irritation and headaches for some VOC exposures and airway irritation for particles and NO₂. Chemical identity, duration and sensitivity determine effects; equal TVOC readings can represent different hazards. The chosen weights only animate the illustration, not symptom severity.
Visual weights: CO₂ 0, TVOC 0.6, PM2.5 0.2, NOx 0.2. Visual weights are design assumptions, not evidence-derived effect sizes; zero means excluded from this illustration, not proven harmless.
Model v2 · Sources consulted 15 September 2026. Inputs are normalized to 0–1: (CO₂ − 420) / 9,580; TVOC / 5,000; PM2.5 / 500; NOx / 400. Each card sums its weighted inputs and bounds the result to 0–1. These linear scales and weights are not fitted to research or WHO guideline values. No exposure duration, chemical speciation, cumulative dose, interactions or personal susceptibility is modelled; zero is not a guarantee of safety. Registry additions automatically render here and in the grid but require evidence review.